We are all looking forward to the upcoming Soccer World Cup and it offers an exciting example to show clearly how to add value to data. Every now and then, I am asked what exactly is Data Analytics? A baker bakes bread, a carpenter works with wood, but analysing data, what does it mean?
No idea about soccer but good at betting
Data analysis allows me as football noob to achieve very good results in betting in the big competitions. For a long time, nobody at the last World Cup wanted to believe that Germany and Argentina will meet in the final, and at the Women’s World Cup 2015 I even managed to win the company’s prediction game.
Data, the raw material of the 21st century?
The internet is full of soccer information and statistics, just as there are countless customer, billing, order, production or marketing data in every business. By itself, raw data are of limited value, but their evaluation and visualisation often provide astonishing insights.
While I visualise company’s data in my professional life, to show how the business develops or where some more effort may be worthwhile. Today I create an Excel model for the upcoming World Cup.
Forecasting the preliminary round
First, I just want to make a prediction for the preliminary round. I already know that I will reuse this predictive model for the main round. So it is worth to think about the processing of the data for a few minutes.
You’ll also find that I’m using simplistic assumptions. On the one hand, I increase the readability of this article. On the other hand, however, it could prove that no proper predictions can be made. I have to keep that in mind, I need a controlling system.
Are you in the know?
Sure, we all know the top teams of the World Cup and while each of us has a slight idea for the game South Korea vs. Germany on June 27th, you could be unsure about Tunisia versus England or Croatia against Nigeria.
The competition consists of 64 games:
- 48 preliminary round matches
- + 8 eighth-final
- + 4 quarter-finals
- + 2 semi-finals
- + 1 game for third place
- + 1 final
Even if you think you know who is ahead of the game, you still have to wonder about the outcome of the games.
The assumptions imported directly from the web
Only two basic assumptions should influence my World Cup bet:
- The stronger team of the world ranking wins
- The score will be influenced by the statistically most frequent results.
As a first step I import the statistically most common scores, the world rankings and the playing schedule from the web to Excel and notice that the Netherlands and Italy are unfortunately not there. What a pity!
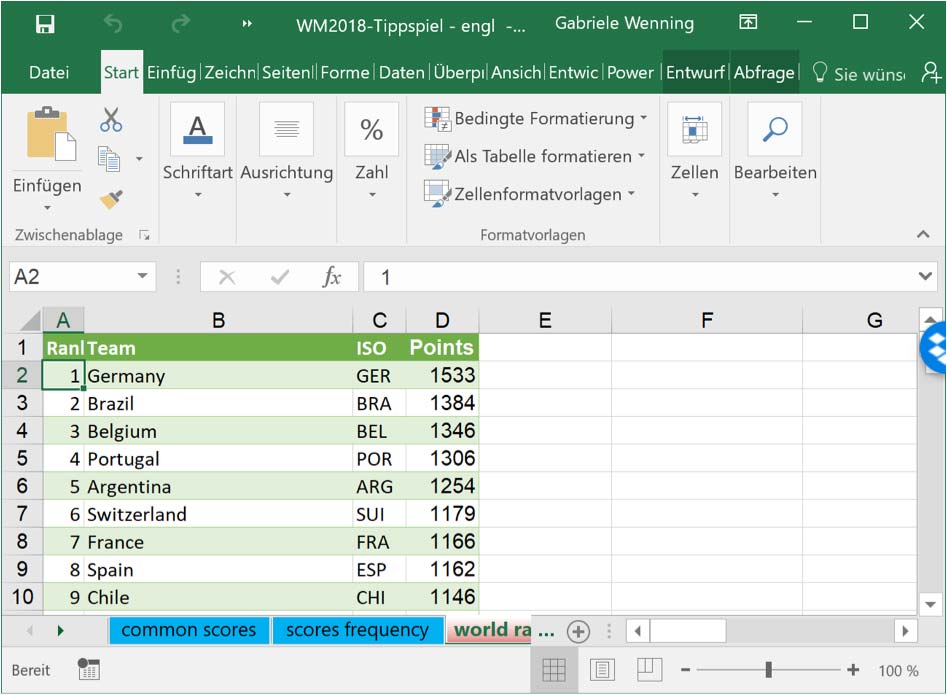
Right at the beginning, I notice that the values have to be processed some more as they are on the web. It’s amazing how much work Excel is doing already. While I can retrieve the world ranking directly from http://www.fifa.com/fifa-world-ranking/ranking-table/men/index.html by using data / data import / retrieve from the web, I still have something to do with the scores:
At http://www.windrawwin.com/statistics/full-time-scores/# I find the results of over 30,000 soccer matches in the current season after regular time but before extra time and penalties. The local differentiation between home and away goals is hardly applicable in a World Cup, so I summarize the scores further. I see that the five most common scores already cover two-thirds of all games. I will use this ratio for my prediction.
So, for the preliminary round, I will use this split:
| Score | Split | Frequency |
| 1:0 | 0:1 | 29% | 14 |
| 2:1 | 1:2 | 22% | 11 |
| 2:0 | 0:2 | 19% | 9 |
| 1:1 | 18% | 8 |
| 0:0 | 13% | 6 |
Few more steps and the bet is completed
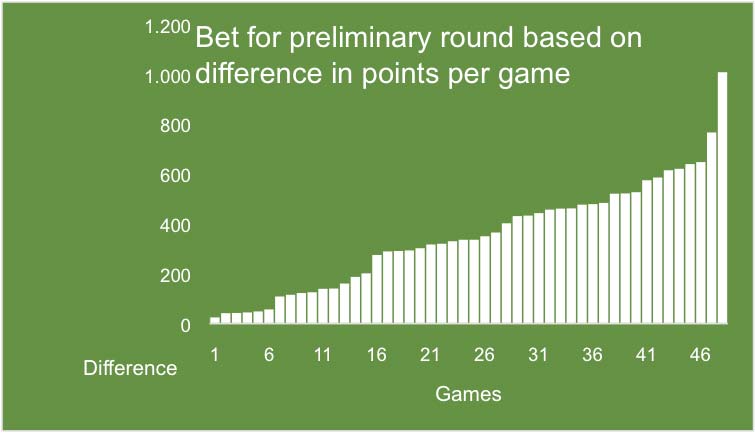
Now I add the points of the opponents in the game plan and calculate their difference between the teams.
I rank those differences, and for the smallest difference, first give the six 0: 0 scores, then the one-to-one for the eight next higher differences, because these teams will perhaps deliver the most balanced games. For the next stage, it is the teams with 200-350 points difference, I expect the biggest game dynamics, and set here the eleven 2: 1 stands, followed fourteen times the 0: 1 and nine times the 2: 0 for the teams with the biggest point difference.
An outlier is the game Germany against South Korea. The difference in points exceeds the thousand mark. I briefly consider breaking my tactics here, but decide to stick to my plan and bet 2: 0.
This post is also available in: Deutsch


